Analyze and Classify Measurements Dialog
The Analyze and Classify Measurements dialog is organized in a typical spreadsheet layout with rows and columns, with columns representing features and rows representing components or instances within the scalar data, such as the labeled objects in a multi-ROI
Choose Utilities > Analyze and Classify Measurements on the menu bar to open the Analyze and Classify Measurements dialog, shown below. You can choose the object(s) you need to analyze in the Choose an Object to Import Scalar Values From dialog.
Analyze and Classify Measurements dialog

A. Tables side panel B. Tables C. Operation tools
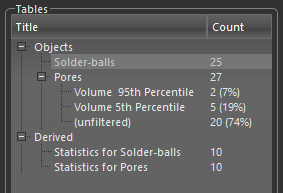
The Tables side panel, shown below, lists all of the tables that were created by importing the scalar data of objects and all of the derived tables in a tree menu. In addition, you can filter data to create sub-groups that match specific criteria. For example, data can be filtered within a range, by percentile, or by logical expressions such as less than, equal to, greater than, and so on (see Filtering Data).
Tables side panel
The tools at the top of the dialog let you to compute new measurements, start a histogram analysis, apply an arithmetic operation, add cross-reference measurements, and compute basic statistics. In addition, you can export your data in the CSV file format.
| Icon | Description | |
|---|---|---|
| New Measurement |
|
Opens the Compute Measurements dialog, in which you can compute new measurements for the object(s) that you are analyzing (see Adding New Measurements). |
| Histogram Analysis |
|
Opens the Histogram Analysis dialog, in which you can plot and analyze the distribution of scalar data contained in an object, compute basic statistics, as well as create classes by selecting instances in the data that match some criteria (see Analyzing Histograms and Creating Classes ). |
| Arithmetic Operations |
|
Opens the Arithmetic Operations dialog, in which you can apply arithmetic expressions to one or more inputs to modify selected measurements or to compute new measurements (see Applying Arithmetic Operations). |
| Cross-Reference Measurement |
|
Opens the Cross-Reference Measurement dialog, in which you can add cross-reference measurements to a table (see Adding Cross-Reference Measurements). |
| Basic Statistics |
|
Opens the Basic Statistics dialog, in which you can compute basic statistics, such as the mean, median, minimum, maximum, and standard deviation of computed measurements (see Computing Basic Statistics). |
| Export as CSV |
|
Exports the current table or selected columns in the comma-separated values (*.csv extension) file format (see Exporting Data as CSV). |
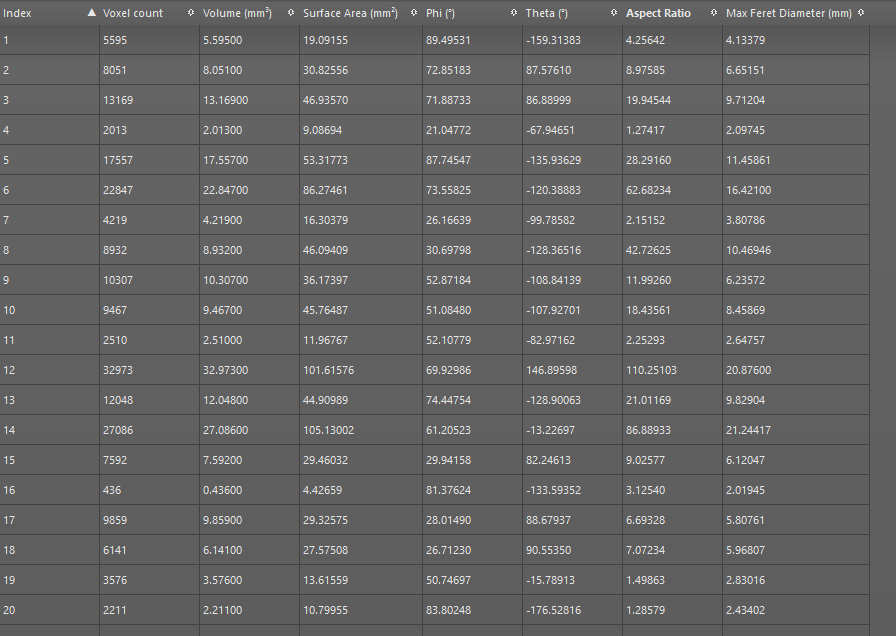
All imported, filtered, and derived scalar data is organized in tables, with columns representing features and rows representing components or instances within the scalar data, such as the labeled objects in a multi-ROI, the faces or vertices of a mesh or graph, or the vectors of a vector field. Features can be length, area, volume, angle, circularity, gray-level intensity value, or anything else that is useful for the application at hand, and every row can be interpreted as a feature vector. In typical object recognition applications, the feature vector of a query object is compared with that of each object in a database to know how much the query object matches with each object in the database.
Table of scalar data
A pop-up menu is available for table columns to sort, filter and delete columns. You can also click the Sort icon to sort columns in ascending or descending order, as well as resize and rename columns.
Column pop-up menu
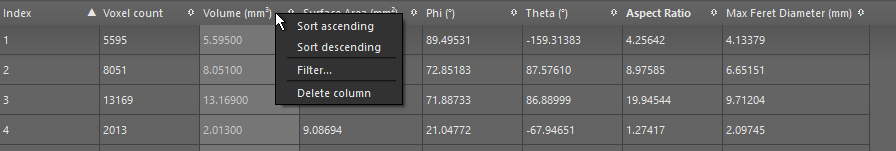
Sort ascending… Sorts the selected column in ascending order.
Sort descending… Sorts the selected column in descending order.
Filter… Lets you filter data to create sub-groups that match specific criteria. Data can be filtered within a range, by percentile, or by logical expressions such as less than, equal to, greater than, and so on (see Filtering Data).
Delete column… Deletes the selected column.
A pop-up menu is available for table cells to set cell values and clear cell contents. You can also type directly inside a cell.
Cell contextual menu
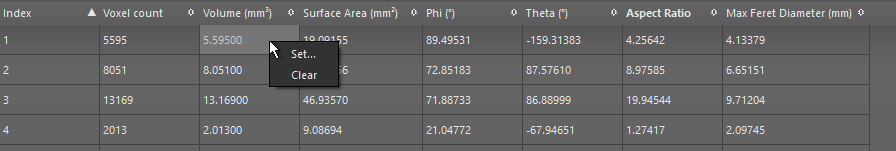
Set… Opens the Set Value dialog, in which can set a value for the selected cell.
Clear… Clears the contents of the selected cell.
